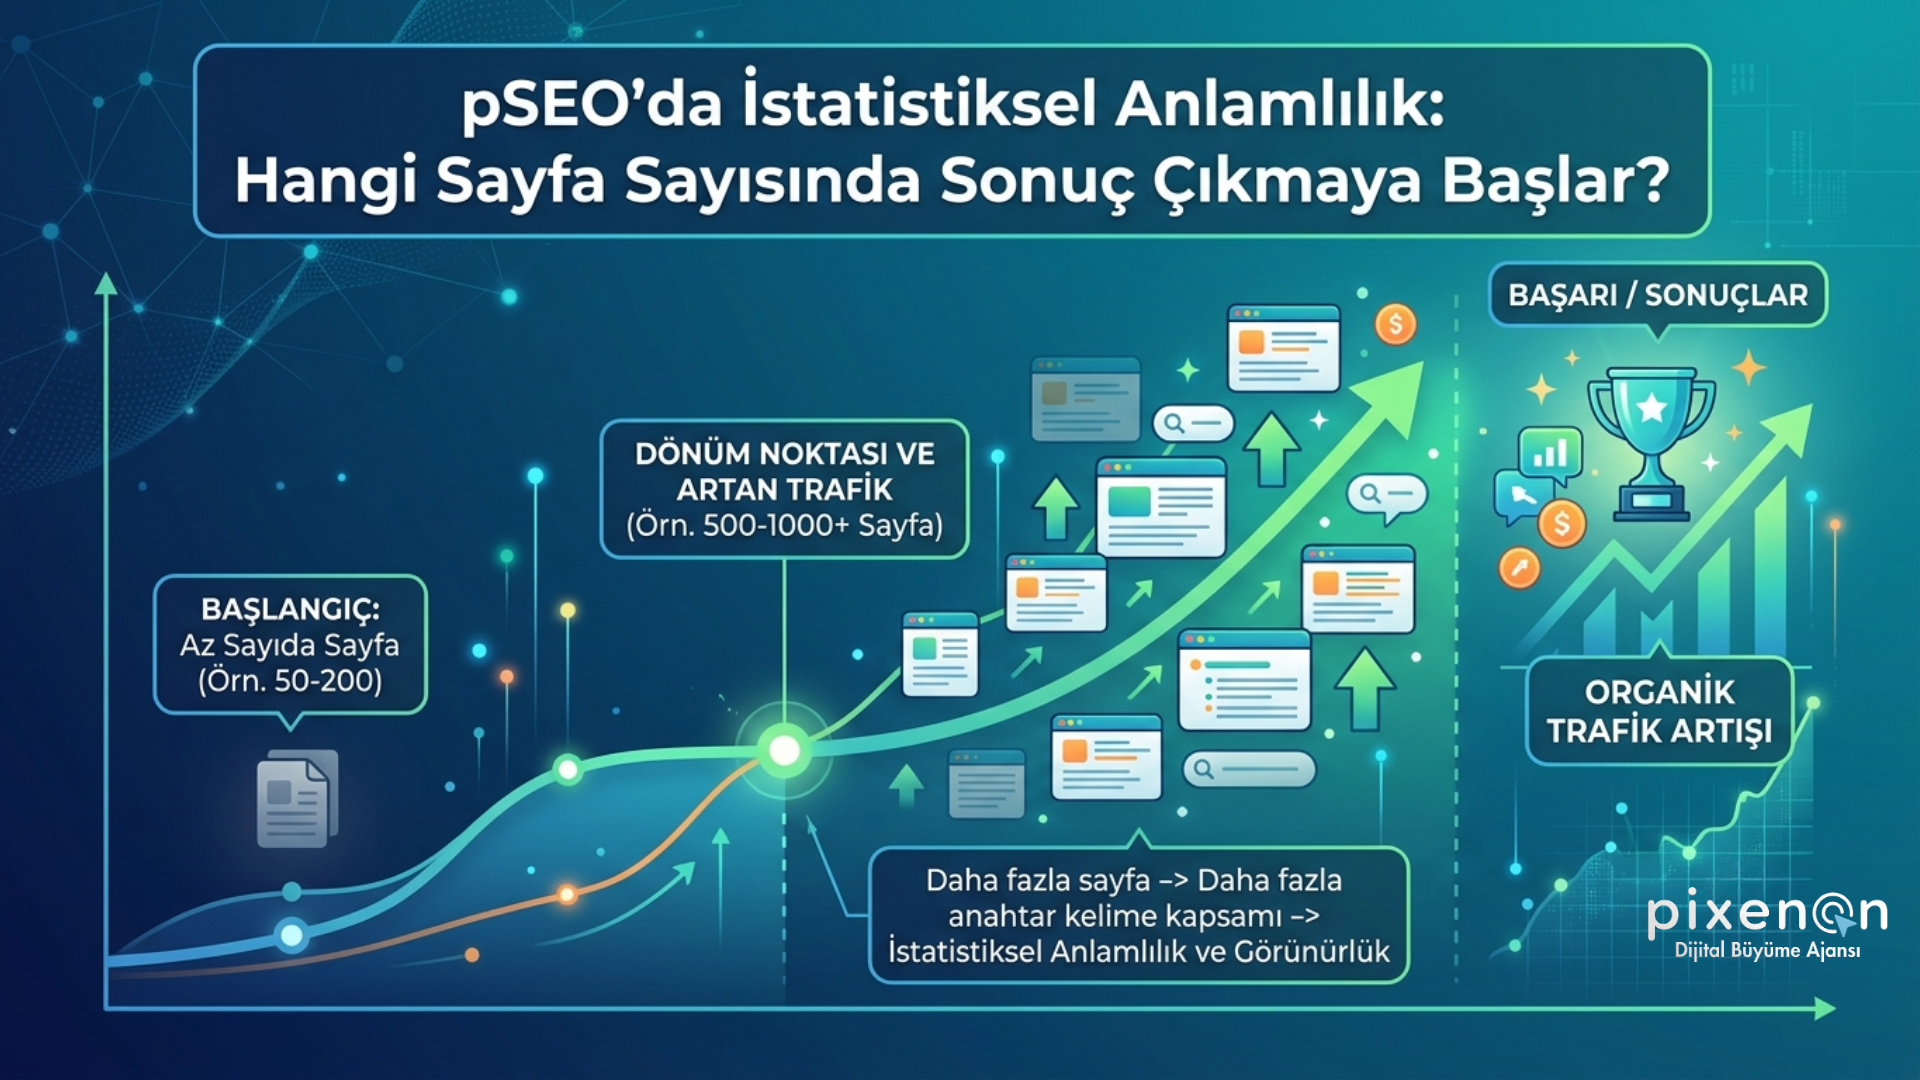
Statistical Significance in pSEO: At What Page Count Do Results Start to Appear?
\n
The Question Itself May Be Framed Incorrectly
\n
The question “at how many pages will I start seeing results” is actually a framework borrowed from the A/B testing culture of the SEO world. To understand this framework, we first need to look at where it comes from.
\n
\n
How classical statistical significance works in SEO
\n
In A/B tests, there really is a sample size calculation: you run a t-test, look at the p-value, and see whether it passes the 95% confidence interval.
\n
Indeed, in an analysis of SEO tests, 42 days of before-and-after data were compared to understand whether a content change actually increased click-through rate, and the p-value came out at 0.00135%, leading to the conclusion that the change was real with 99.99% confidence.
\n
This is a good example of how classical statistical significance works in SEO: a measurable, reproducible, mathematically defensible result.
\n
\n
Why pSEO does not fit this model
\n
pSEO does not fit this model, because the fundamental assumption collapses here. Because the hundreds or thousands of pages you produce in pSEO are not independent random samples from one another; each one enters a separate search query, a separate competitor group, a separate intent level.
\n
The “Istanbul office moving prices” page and the “Izmir web design packages” page are not two samples coming from the same distribution in terms of statistical population; each one fights a separate battle in its own market, with its own competitors and its own search volume.
\n
So saying “I published 500 pages, it is statistically significant” is not actually the same as saying “I entered 500 different small competitions at the same time.” There is no academically validated, universal threshold number; what exists are behavioral thresholds that the industry has observed repeatedly.
\n
For this reason, the numbers given throughout this article should also be read not as claims of certainty, but as practical reference points distilled from recurring case studies.
\n
\n
First, It Is Necessary to Understand What Should Not Be “Counted”
\n
Before talking about numbers, it is necessary to clarify which pages should not even enter the count. Because the biggest cause of failure in pSEO is not an insufficient number of pages, but page quality being scattered from the very beginning.
\n
\n
Two conditions for a working pSEO page
\n
Industry analyses show that a working pSEO page must meet two criteria at the same time: at least 500 unique words per page, and at least 30-40% content differentiation compared to the template draft. The first criterion is quantitative, while the second is more nuanced and often overlooked.
\n
This second criterion is especially critical, because the most common mistake in pSEO happens exactly here: if the only difference between the “SEO agency in Istanbul” page and the “SEO agency in Ankara” page is the city name, then this is technically not two different pages but two copies of the same page, and Google sees it that way.
\n
Even if the template logic seems to be set up correctly, if there is no data richness underneath it, what emerges is automated repetition, not automated value.
\n
\n
Two cases with a heavy cost
\n
There is a case that shows the concrete cost of this situation: the company Datanyze lost 96% of its traffic on its programmatic pages under the /companies and /people subfolders.
\n
This loss remained limited to an isolated subfolder, meaning the problem was not across the entire site but concentrated exactly in the area where the low-differentiation template was applied.
\n
This also shows that automation is penalized selectively; Google targets not the entire site but the specific area where low-quality production took place.
\n
An even more striking example is an event referred to as the “SEO heist,” where traffic collapsed by 99.52% after a pile of 1,800 AI articles was published.
\n
Both of these examples show how a high page count, when combined with low quality, produces the exact opposite result. So before asking the question as “how many pages,” it is necessary to ask “how many pages are actually different from one another.”
\n
\n
The Root Causes of Programmatic SEO Errors Confirm This
\n
Three root causes
\n
An analysis of why failed pSEO programs fail reduces nine different common mistakes to three main root causes: insufficient data, broken technical infrastructure (canonical errors, faulty internal linking), and the absence of a post-publication feedback loop.
\n
This three-part classification is important because it separates two different problems that are often confused in the industry: on one side there is “content insufficiency,” on the other side there is “technical infrastructure insufficiency,” and their solutions are completely different.
\n
\n
“Thin content is a dataset problem, not a template problem”
\n
There is a point especially emphasized in this analysis: the thin content problem is always a dataset problem, never a template problem.
\n
That is, the problem is not “how you write the template” but “what you can feed into the template”; if you do not actually have 500 different, meaningful data points (price, reviews, statistics, images) for 500 different cities, then no matter how many pages you publish, the result ends up in the same place.
\n
This also explains an investment mistake frequently made in the industry: many teams spend months working on template design, page layout, and title formats, but never build the original dataset to put underneath them. Yet the correct order is the exact opposite: first data richness, then the template.
Phased Thresholds: Pilot, Validation, Scale
Once this framework is accepted, a three-phase structure that repeats across the industry becomes visible. These are not mathematically proven limits, but practical ranges distilled from repeated case studies. Each phase has its own purpose, its own success metric, and its own risk.
Pilot phase (50-100 pages)
The pilot phase usually stays between 50 and 100 pages. The purpose of this phase is not to get traffic, but to observe how the template is received by Google. Is it being indexed, how long does indexing take, is canonical tagging working correctly, is a page speed issue arising these are the questions that need to be answered at this stage.
A concrete example shared by an SEO practitioner illustrates this scale: a 75-page pilot produced with a tool like SEOmatic reduced research and publishing time from a job that would normally take 12 hours to 3 hours.
But this time saving does not mean the result will bring rankings it only proves production speed, not the result. Confusing “speed” with “success” in the pilot phase is the most common misconception at this stage.
From a technical standpoint, the pilot phase is also a comfortable zone: the crawl budget (the capacity Google allocates to crawling a site) issue does not create a real constraint as long as the site’s total URL count does not exceed a few thousand.
According to one source, crawl budget management becomes an issue requiring attention above 10,000 pages, and gains critical priority above 100,000 pages; below 10,000 pages, basic hygiene is sufficient, and energy should be allocated elsewhere. So in a 50-100 page pilot, crawl budget never comes up if there is a problem at this stage, the reason is most likely not technical capacity, but content quality.
Validation phase (a few hundred pages)
The validation phase grows to a few hundred pages. Here, what matters is no longer the performance of individual pages, but comparison between template variations: which data type (price-focused, review-focused, or comparison-focused) is actually being indexed and ranked?
Industry guides recommend scoring pages at this stage with a systematic rubric using criteria such as potential search volume, scalability (how many more pages can be produced from this pattern), and competitive advantage (does the proprietary data you hold make a real difference in the SERP).
A template that fails this scoring is eliminated before scaling because a pattern that does not work at 300 pages will not work at 3,000 pages either, it just carries three thousand times more risk.
At this stage, one more technical factor comes into play: internal linking architecture. Large-scale site analyses show that about a quarter of web pages receive no internal links at all, and on large sites fewer than half of pages receive sufficient internal links.
If you do not set up this architecture properly in the validation phase, when you move to the scale phase, a significant portion of the thousands of pages you produce will remain as “orphan pages” meaning they become undiscoverable by Google, no matter how large the number is.
Scale phase (thousands)
The scale phase is where the real numbers are discussed. Two extreme examples are constantly referenced in the industry here.
Canva’s color palette pages offer a modest but steady model: 1,900 pages, 83,000 visits per month, meaning an average of 44 visits per page.
This figure may seem small, but it steadily feeds a low-competition, high-intent tail, and this kind of performance shows that a “few but deep” pSEO strategy can also deliver consistent results.
At the other extreme is Zapier with over 800,000 indexed pages generating 16.2 million organic visitors per month. But this point was not reached overnight; it is the cumulative result of years of template improvement, internal linking optimization, and data enrichment.
At this scale, crawl budget now becomes a central issue a technical source states that crawl budget optimization is an “upstream” problem on large sites that can surface ranking improvements that content or link work could never achieve.
In other words, for a site at Zapier’s scale, the question is no longer “how many pages did I publish,” but “how many of these pages can Google actually crawl and process.”
The Real Determining Variable: Not the Number, but Time
There is a point more important than everything described so far, and it is skipped in most pSEO discussions: what determines whether a result will emerge is less the number of pages than how those pages trend over time.
The 16-month curve and the “valley of death”
A 16-month tracking study by Ahrefs shows this very clearly. AI-assisted articles are indexed at a high rate of 70.95% in the first month meaning Google initially appears to see and accept these pages.
But by the third month, the share of pages remaining in the top 100 collapses to 3%. This decline occurs during the period between the second and sixth months, which the industry calls the “valley of death.” However, the story does not end here: by the 16th month, this rate recovers to 20%.
So the curve is not a straight line, but a curve that first rises, then drops sharply, then partially recovers. The practical meaning of this is: panicking in the second month after publishing a 50 or 100 page pilot because “nothing is happening” may mean stopping at exactly the lowest point of the curve and passing judgment.
The truly meaningful measurement is not the first month, but the trend after the third month, and even a 12-16 month window is needed for the full picture.
The 2025 deindexation signal
At this point there is also a broader-scale risk. At the end of May 2025, 25% of tracked URLs were actively removed from Google’s index this was reported as the highest active deindexation rate on record.
This figure shows that in large-volume pSEO experiments, the logic of “the more pages I publish, the safer I am” no longer holds. As Google’s quality threshold rises, large volumes with low differentiation become far more fragile than before.
When you put these two data points side by side, the picture that emerges is this: pSEO is no longer a “publish and forget” tactic, but a system that must be continuously monitored. Initial indexing is a starting signal, not proof of success.
Ratio Instead of Number: The 70/30 Rule
Why a ratio instead of an absolute number
What the most experienced practitioners in the industry have in common is that they set a resource allocation ratio instead of an absolute page count target.
The most common model is to allocate roughly 70-80% of published content to long-tail, data-driven, programmatic pages, while the remaining 20-30% goes to hand-written guide and research content that builds authority and trust.
The logic behind this ratio is this: pSEO provides volume but does not produce authority; long-form content produces authority but does not provide volume. The two feed each other—the ability of pSEO pages to rank depends largely on the overall authority of the domain, and that authority is built mostly by hand-written content. Therefore, the answer to “how many pages should I publish” actually turns into the question “how much authority have I accumulated,” and authority grows not with page count, but with ratio.
Practical Implication for Pixenon
When you bring all of this together, the most realistic approach is to treat page count not as a target, but as a test size.
First, the indexing and ranking behavior of the template is observed with a pilot group of 50-100 pages—at this stage there should be no traffic expectation at all, only technical signals should be monitored.
The validated template is expanded to a few hundred pages, and by looking at its trajectory after the third month, it is determined which sub-segments (which city, which service combination) actually gain traction.
At this stage, the internal linking architecture must be built meticulously; otherwise, a significant portion of the pages produced during the scaling stage remain undiscovered.
Only after this point are the patterns that gain traction scaled to thousands, and during this expansion, roughly three-quarters of the content volume is allocated to programmatic pages, while the rest goes to hand-written content that carries Pixenon Grup’s founding authority and Pixenon’s case studies.
As the scale grows, the retention rate after the third month and the risk of deindexation, rather than page count, become the key indicators to monitor.